
Task Management Audit & Reporting
Project Snapshot
Executive Summary
Built a scalable reporting system that transformed task data into actionable operational insights, enabling healthcare administrators to identify workflow bottlenecks and improve efficiency across multi-location practices.
Company
McKesson / Ontada
Project
Designing an enterprise audit and reporting system to analyze task workflows within a large oncology EHR platform.
Role
Senior UX Designer — Led UX, information architecture, and reporting design across a complex enterprise data environment.
Users
Practice administrators, operational leaders, and clinical managers overseeing workflow efficiency across oncology practices.
Problem
Administrators lacked visibility into how tasks moved through clinical workflows, making it difficult to identify inefficiencies, workload imbalances, and operational bottlenecks.
Key Contribution Areas
Designed task-level and event-level reporting models
Defined scalable information architecture for high-volume data
Translated stakeholder questions into structured data requirements
Designed filtering systems for complex enterprise datasets
Collaborated with engineering on derived metrics and data modeling
Project Overview
Within the Ontada oncology EHR platform, clinical offices manage large volumes of internal work through a task management system. Every incoming phone call, patient request, or internal assignment generates a task, which can contain multiple events handled by different members of the care team.
While this system effectively tracked activity, administrators had very limited visibility into how work was actually being performed across teams, locations, and time.
Leadership initially asked for a simple audit report that would show:
What tasks had been completed
Which tasks remained open
Who worked on them
How long they took to close
However, as discovery progressed, it became clear that a single audit view would not provide the operational insight administrators were looking for.
What began as a lightweight reporting request quickly evolved into a larger reporting system designed to help healthcare practices analyze workflow efficiency and staff workload across multiple locations.
The Design Challenge
Designing reporting for the task system introduced several key challenges.
High Volume of Data
Even a single clinical office could generate hundreds of tasks and thousands of task events per day. The reporting system needed to process and present this data without overwhelming users or compromising performance.
Our largest stakeholder organization, Texas Oncology, operated across 300+ locations, requiring reports that could be filtered and analyzed across practices, locations, providers, and task types.
Multiple Levels of Analysis
Administrators were trying to answer very different types of questions:
Some questions were high-level operational questions, such as:
How many tasks are being created at each location?
Which task types take the longest to resolve?
Are certain practices experiencing workflow bottlenecks?
Other questions required detailed auditing, such as:
Who handled a specific task?
What actions were taken within that task?
How long did each step take?
Designing a system that supported both high-level operational analysis and detailed auditing required careful consideration of how data should be structured and presented.
System Constraints
The EHR itself had limited capabilities for the level of aggregation and reporting stakeholders needed. As a result, the reporting solution needed to integrate with Datanyx, a separate reporting platform capable of handling larger data sets and more complex queries.
This added additional complexity to the design process, requiring close collaboration with engineering to ensure the interface aligned with the technical architecture.
Example of the early filtering above the data set.
Task Management Report - Finalized
Task Event Report Handoff file from Figma
Task Event Report - Finalized
Task Report Data Set
Event Report Data Set
Research
Understanding Stakeholder Needs
To better understand the reporting requirements, I conducted interviews with several groups involved in managing clinical operations:
• Practice administrators
• Operational leaders
• Clinical staff responsible for managing tasks
Early conversations revealed that stakeholders were not simply looking for accountability. They were trying to understand how work moved through the organization and where inefficiencies occurred.
Many of the questions they asked went beyond what a simple audit log could answer.
Examples included:
Why are certain tasks taking longer to close?
Are specific locations experiencing heavier workloads?
Which users are consistently overloaded?
Are certain task types creating operational bottlenecks?
These conversations revealed that the reporting system needed to support operational analysis, not just historical auditing.
Design Strategy
To address the wide range of questions administrators needed answered, the reporting system was designed around two key principles:
Separation of analytical layers
Rather than forcing all reporting into a single complex interface, the system separated reporting into two levels:
Task-level reporting for operational analysis
Event-level reporting for detailed auditing
Scalable data filtering
Reports needed to support flexible filtering so administrators could analyze data across:
Practice
Location
Provider
Task type
Priority level
Individual users
This structure allowed administrators to move from broad operational insights to detailed investigation when necessary.
Defining the Data
One of the most important phases of the project involved identifying the data required to support meaningful reporting.
We began by collecting every question administrators wanted answered by the reporting system. From these questions, we identified the data points required to generate those insights.
During this process, we discovered that several key metrics were not explicitly tracked within the existing task model.
Working with engineering, we identified ways to derive these metrics using reference data already present within the system. These derived data points allowed us to generate more meaningful analytics, such as:
Average task completion time
Event duration
Priority-based close times
Workload distribution across users
Because of the high volume of task data generated by large oncology practices, performance and query efficiency became major design considerations throughout this phase.
Key Design Decisions
Through iterative design and testing, the reporting system ultimately evolved into two complementary reports, each designed to answer different types of operational questions.
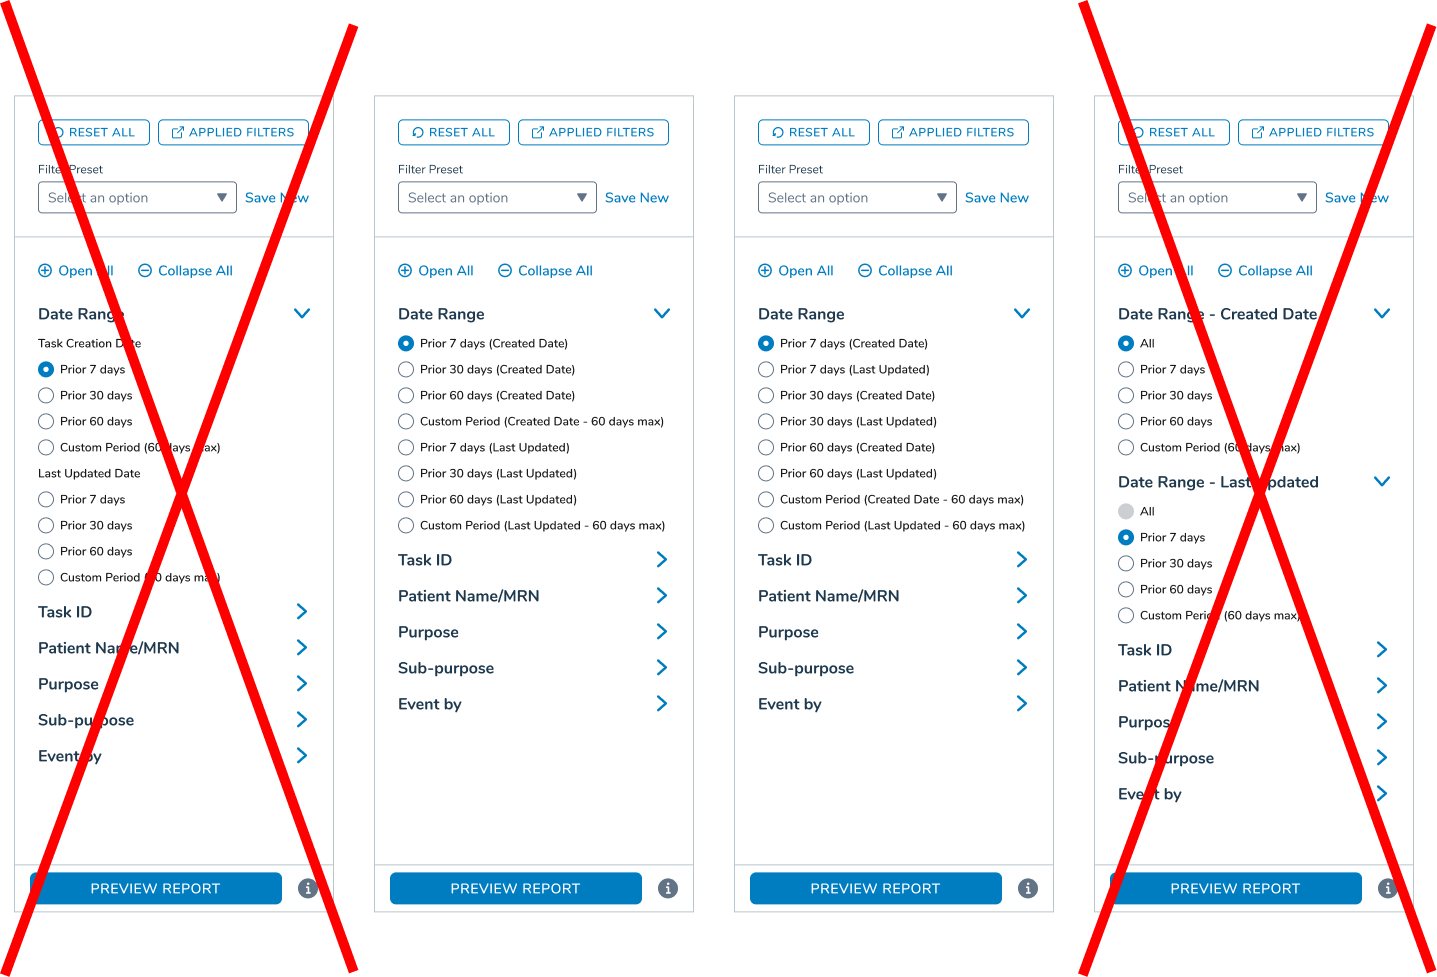
Another important usability challenge emerged as we began designing the reporting interface: both reports required a large number of filters in order for administrators to meaningfully analyze the data.
In many reporting interfaces, filters are placed across the top of the page above the data table. However, as the number of filters increased, this approach quickly consumed valuable vertical space and pushed the data table further down the page. Because administrators were often working with large datasets, maximizing the visible area of the table became an important usability consideration.
To address this, the filters were instead organized in a persistent left-side filter panel. This layout allowed users to quickly adjust filters while keeping the majority of the screen focused on the report data itself.
This approach provided several advantages:
Preserved vertical space for larger data tables
Allowed filters to remain visible while scrolling through results
Created a consistent filtering experience across both reports
Reduced the visual clutter that would have resulted from a large horizontal filter bar
The left-side filtering model ultimately made it easier for administrators to iteratively refine queries while maintaining visibility into the data they were analyzing.
Task-Level Report
The Task-Level Report provided a high-level overview of task activity across practices and locations.
Each task appeared as a single entry, allowing administrators to quickly analyze trends and identify workflow bottlenecks.
Key questions this report helped answer included:
How many tasks were created within a specific location or practice
Average time required to close tasks
Which task types consistently took longer to resolve
Which tasks remained open
Average close time by priority level
All tasks handled by a specific user or provider
This report allowed administrators to identify patterns and operational trends without needing to analyze individual task events.
Event-Level Audit Report
While the Task Report provided high-level insight, the Event-Level Report focused on detailed auditing of activity within individual tasks.
Each event inside a task was recorded separately, allowing administrators to analyze exactly how work progressed.
This report allowed administrators to answer questions such as:
Who worked on a specific event
How much time was spent on each event
What actions occurred within a task
The sequence of events within a workflow
For example, while the Task Report could show how many high-priority tasks were closed in a week, the Event Report could reveal how long a specific nurse spent completing assigned events across all of their tasks.
Together, these two reports provided both operational insight and detailed auditing capability.
Outcome
The reporting system launched successfully within the Ontada platform, giving administrators visibility into task workflows across practices, locations, and teams.
Post-launch usage and stakeholder feedback indicated measurable operational improvements:
Administrators were able to identify workflow bottlenecks and inefficiencies more quickly
Reporting reduced the time required to investigate task activity and staff performance
Practices gained visibility into workload distribution, enabling more balanced staffing decisions
Derived metrics (e.g., task duration, event time) provided new insights that were not previously accessible
The system scaled effectively to support large organizations, including multi-location practices with high daily task volumes
Design Impact
The reporting system transformed task data from a passive record into an operational decision-making tool.
By making workflows measurable and transparent, the system enabled administrators to:
Reduce time spent manually investigating task activity
Identify and address workflow bottlenecks earlier
Improve staff workload distribution across teams and locations
Surface training gaps based on task performance patterns
Make more informed operational decisions using consistent reporting models
This work established a scalable foundation for reporting across the Ontada platform and demonstrated the value of designing around stakeholder questions rather than predefined outputs.
Reflection
This project reinforced an important lesson: the problem stakeholders initially describe is often only part of the real challenge.
What began as a request for a simple audit report evolved into a much larger effort to understand how work flowed across complex healthcare organizations.
By focusing on the underlying questions administrators were trying to answer, rather than the specific feature they requested, we were able to design a reporting system that delivered far greater operational value.
Example of a Task generated in the iKnowmed EHR
An early mockup of a Task Audit Report
Early notes from meeting with Stakeholder clarifying what they wanted from this report
I worked extensive with stakeholders exploring filter options and how they worked to increase overall useability for both reports.
Notes determining which event types were available which were not trackable